


Written by Bram De Coninck
This is the second part of an experiment, where we created the same app five times, each time with a different framework. Read the first part of this experiment how Flutter compares to native Android, native iOS, React Native and Xamarin Forms here »
Measuring the performance of the Android applications
This experiment will determine the performance of the Android applications created during the first experiment. To conduct this experiment, I used the Android Profiler, a tool built into Android Studio. This tool allows you to collect data about CPU-usage, network activity and memory/battery consumption. I chose to focus on the CPU-usage as performance indicator for this experiment.
It’s best to use a physical device for this experiment. I used the smartphone the smartphone I owned at the time, a OnePlus 6T with the following specifications:
- Operating System: Android 9.0 (Pie); OxygenOS 9.0.13
- Chipset: Qualcomm SDM845 Snapdragon 845 (10nm)
- CPU: Octa-core (4x2.8 GHz Kryo 385 Gold & 4x1.7 GHz Kryo 385 Silver)
- GPU: Adreno 630
- Memory: 8 GB RAM
- Storage: 128 GB ROM
How the experiment was conducted
When conducting this experiment, a certain route was followed in every application and in the meantime the Android Profiler kept track of the CPU-usage. This tool then generated graphs to visualize the data it gathered. These steps were followed in every application:
- Open the app and wait until the cocktails are loaded in
- Start measuring the CPU-usage
- Scroll down to the bottom of the list of cocktails
- Scroll back up to the first cocktail in the list
- Click the first cocktail in the list
- Return to the list of cocktails
- Open the list of ingredients
- Scroll down to the bottom of the list of ingredients
- Enter ‘Gin’ into the search field
- Click on the ‘Gin’ ingredient. (This brings you back to the cocktail list screen.)
- Scroll down to the bottom of the list of cocktails again
- Scroll back up to the first cocktail in the list again
- Click the first cocktail in the list
- Return to the list of cocktails
- Click on the ‘suggestion’ button in the bottom navigation bar
- Write the word ‘description’ as description
- Click on the camera button, grant permissions and take a picture
- Tap the ‘Make suggestion’ button
Preparations for the experiment
I was able to install the native Android application correctly on my device using Android Studio, which was very easy. Correctly installing the other applications wasn’t as straightforward. To install the Flutter application for example, I had to use the command flutter run –profile. I wasn’t able to use a debug build because the Flutter application would have been compiled JIT (Just In Time, used for debugging) instead of AOT (Ahead Of Time, used for release and profile builds). This would have tempered the performance of the application.
In the Xamarin Forms project I enabled ‘Enable developer instrumentation (debugging and profiling)’ before installing the application. To install the React Native application I first had to start Expo and then enable profiling and install the application.
Results of the experiment
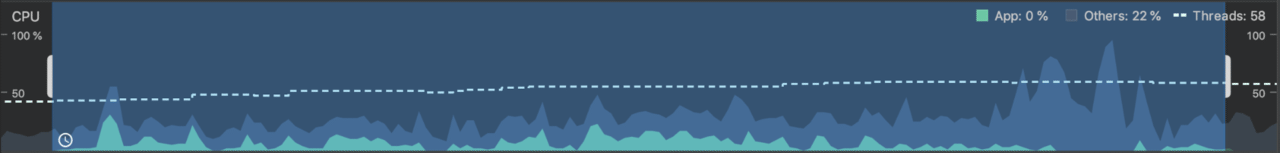
The graphs underneath were generated by the Android Profiler. The green waves represent the CPU-usage of the application. The dark blue waves represent the CPU-usage of other processes. The vertical lines represent the moments in time where started and stopped measuring the CPU-usage.
Take a moment to look back at the steps I followed in every application to notice that certain actions were more CPU-intensive than others. The spike you see near the beginning of every graph is when I started scrolling in the list of cocktails. The spike near the middle of the graph is when I started scrolling in the list of cocktails again, but this time all cocktails with gin as ingredient were shown. That list has more cocktails in it than the original one.
CPU-usage of the native Android application:
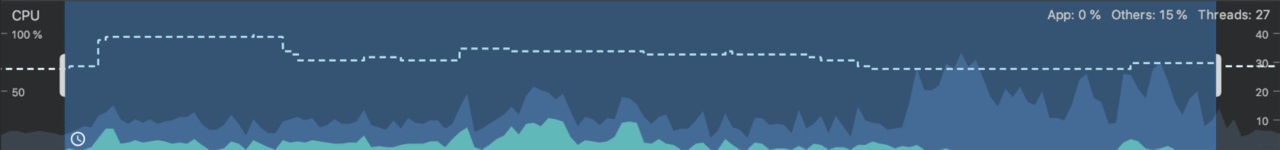
CPU-usage of the Flutter application:
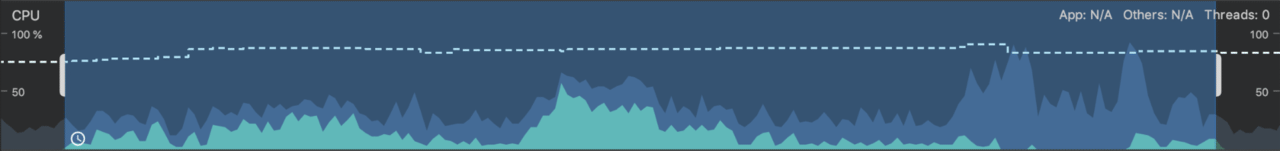
CPU-usage of the React Native application:
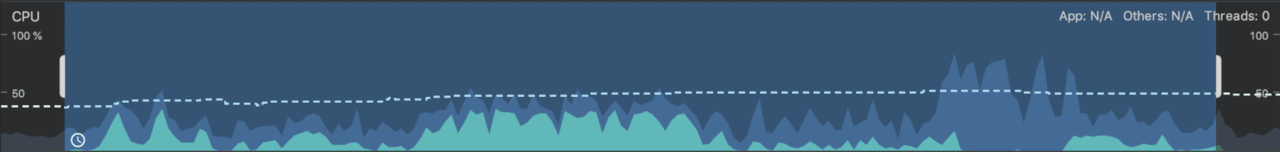
CPU-usage of the Xamarin Forms application:
Conclusion of the second experiment
The table below contains statistics based on the data off the graphs that were generated by the Android Profiler.
The first thing that stood out to me is that every application has a minimum CPU-usage of 0%. This happened when I opened the cocktail creation screen. At that time, the application is in a static state, causing the CPU temporarily unused.
The second thing that stood out to me is that the 4 apps can be split into 2 groups. The CPU-usage of the Flutter application peers with the CPU-usage of the native Android application, while the CPU-usage of the React Native application matches the CPU-usage of the Xamarin Forms application.
Before conducting this experiment, I had anticipated that the native Android application would have been the most performant one and the apps of the cross-platform frameworks would follow. For the most part this is true, but the Flutter application is an exception to this. The Flutter application was even slightly more economical on the CPU.
When I was conducting the experiment it was already noticeable to me that the Xamarin Forms and the React Native application struggled when I scrolled through the list of cocktails. I think this is because of all of the cocktail images that needed to be downloaded. The Xamarin Forms application also struggled a bit when I was scrolling down the list of ingredients, which only had text and no images.
It’s obvious that the CPU-usage of the Flutter application is smaller than that of the React Native and Xamarin Forms applications, and that’s why I declare Flutter the winner of this experiment.
| Native Android | Flutter | Xamarin Forms | React Native | |
|---|---|---|---|---|
| Minimum | 0 | 0 | 0 | 0 |
| Maximum | 30.1 | 23 | 33.9 | 43.4 |
| Mean | 7.29143 | 5.41875 | 12.7 | 13.41316 |
| Median | 5.4 | 4.4 | 8.3 | 10.75 |
| Mode | 0 | 0 | 2, 13, 1, 1, 29.4 | 3, 15.8, 0.8, 5.7, 6.6, 5 |
| Standard deviation | 6.01632 | 5.07775 | 11.13211 | 11.22813 |
| Coefficient of variation | 36.1961 | 25.78351 | 123.92389 | 126.0709 |
Is Flutter more performant than React Native and Xamarin Forms?
In the second experiment it was concluded that the Flutter application was less taxing on the CPU than the React Native and Xamarin Forms applications. This doesn’t automatically prove that Flutter is more performant than React Native or Xamarin Forms.
There are a lot of features that the Cocktailr app doesn’t have, like caching for example. That would reduce the amount of network requests that need to be made and would make the app more performant, meaning that it could lead to different results. I also only used CPU-usage as a performance indicator. I don’t have any data on the memory or battery consumption for example. These are also an important performance indicators.
I didn’t know beforehand what the results of this experiment were going to be. All I hoped to prove is that Flutter can stands its ground against other cross-platform frameworks, and I think I achieved that goal.
Read more how to add Flutter modules to native Android project and test it on Codemagic here »
Bram De Coninck is a Mobile App Developer (Android, Xamarin & Flutter) born in Belgium. He recently graduated at University College Ghent in Applied Computer Science. He’s been passionate about Flutter since it was in Beta and his current mission is to start using Flutter at his workplace.
- Website: https://bramdeconinck.com/
- GitHub: https://github.com/BramDC3?tab=repositories
- LinkedIn: https://www.linkedin.com/in/bramdc/
- Twitter: https://twitter.com/BramDC3


