


This article is written by Himesh Panchal
The app size on my phone is 1GB which is double the size of my next largest banking app and 10 times the size of the following two. Does SoFi care to optimize the app? I’m hoping getting rid of the crypto exchange will reduce the overall size.” Said Mizzo12 on Reddit
For too long, have we sat silent and allowed our app sizes to grow too big! While some of us enjoy the luxury of 5G internet and what seems like infinite storage, not everyone does!
So.. let’s roll up our sleeves and peek into the world of iOS app size optimisation with our trusty sidekick - Emerge Tools.
An in-depth analysis of SoFi banking app using Emerge Tools sheds light on how even well-known applications can significantly reduce their footprint.

The above insights suggest a potential 30.1 MB savings by optimising images, a 7.09% cut in the app’s size. Emerge also identifies opportunities to eliminate 24.0 MB by removing duplicate files and reclaiming 1.5 MB by minifying localized strings.
This blog post teaches you how to monitor your app size using Emerge Tools and Continuous Integration.
💡 Emerge Tools is designed to help developers monitor and reduce app size, prevent performance regressions, build user interfaces confidently, improve app startup time, and find and eliminate dead code. Using advanced analytics and visual reporting, Emerge Tools provides developers with the insights they need to identify areas of their code and take action to reduce app size.
A Technical Journey
Pull Request Comments
Let’s take a closer look at how Emerge Tools works, specifically its pull request comment feature. The PR comment feature simplifies understanding how the code changes contribute to the increasing of the application’s size.
Comments are posted by default when the size change exceeds 100 KB, a threshold that users can customise in their Emerge profile settings for flexible monitoring.
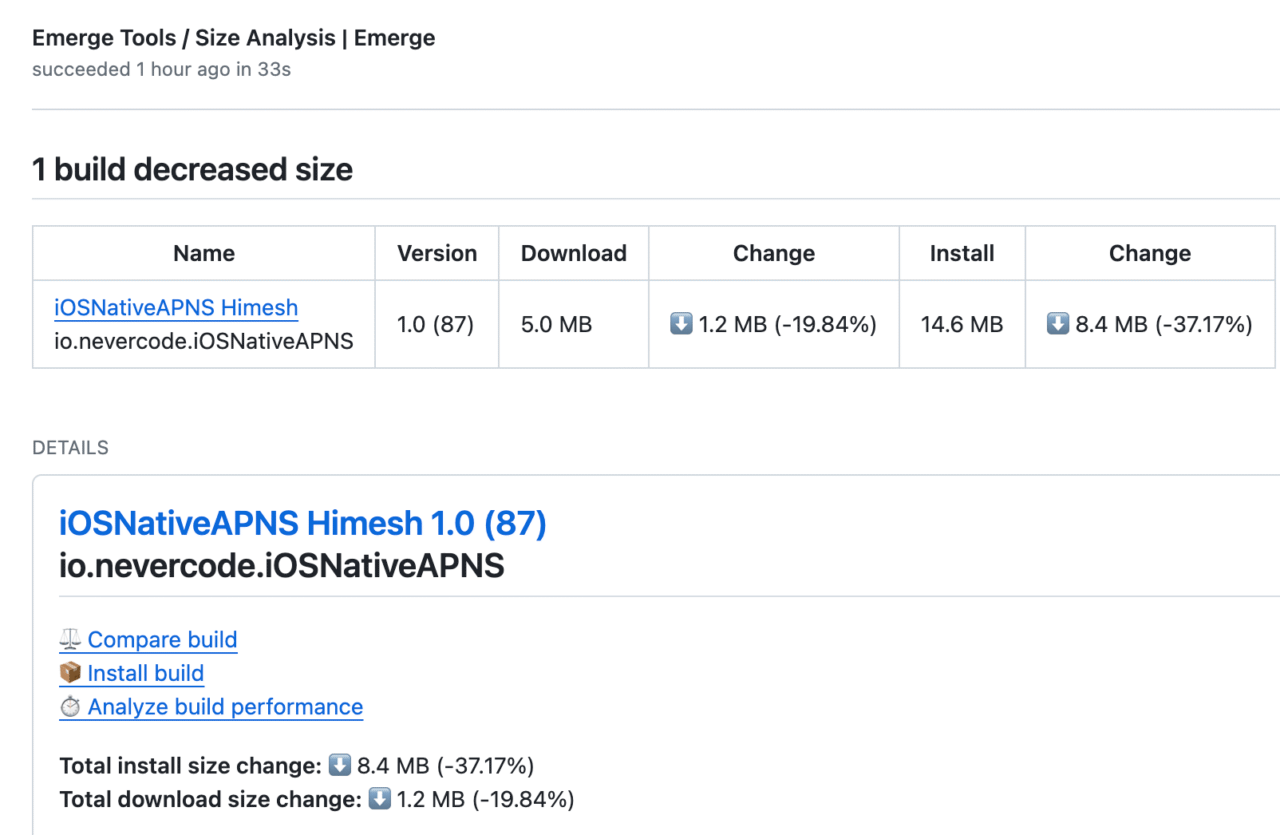
As shown below, it details the breakdown of a comment into three sections: Overview, Largest changes breakdown and Diff Treemap.

The Overview section displays the app size and links detailed build information. For example, we have optimised the current build version 1.0 (87), resulting in a reduction of the download size by 128.2 kB (-2.02%) and the install size by 1.1 MB (-4.49%).
The Largest changes breakdown spotlights the largest leaf nodes in your app’s breakdown. These leaf nodes represent the final standalone components or elements that make up the application’s structure, contributing significantly to the app’s size. By default Emerge Tools displays the top 20 elements with a size over 500 bytes.
The Diff Treemap provides a hierarchical view of changes, with colours indicating types of changes. In this visualisation, red and green indicate decreasing and increasing aspects of your app’s code, files or data.

Automation with Emerge Tools and Codemagic
We will guide you through using Emerge Tools with a sample iOS app that reflects typical development scenarios, including a mix of media content and external pod dependencies.
Connect GitHub Repository
Follow the steps below to integrate Emerge Tools GitHub apps, which will automatically handle the PR comment feature when we create a new Pull Request for our sample iOS app.
Start by configuring a GitHub connection in your Emerge Tools profile settings. After authenticating using GitHub, select the relevant account to install the Emerge Tools application.

Select the repositories you want Emerge to integrate with GitHub, then click Install to complete the integration with Emerge Tools.

Setting up REST API Integration
- Navigate to the Account section and generate a new API key.
- Copy the key and store it as an environment variable, e.g. EMERGE_API_KEY, in the Codemagic app settings.
- Remember to add a group name, such as
emerge_tools, and mark it as secure.
Now, you can upload builds to Emerge Tools. It accepts three types of upload formats for iOS builds:
- Zipped XCArchive: With extension
.zip(specifically zipped .xcarchive). - IPA: With the extension
.ipa. - Zipped XCFramework: With extension
.zip(specifically zipped .xcframework).
Integrating with Continuous Integration
Codemagic provides the easiest way to integrate various checks into your development pipeline. For our sample iOS app, we will be using .xcarchive in this article.
After generating the IPA artifact, the below script finds and compresses all directories ending in .xcarchive into a single zip file named iOSNative.zip.
scripts:
  ...
  - name: Build IPA
    script: |
        xcode-project build-ipa \
            --workspace "$CM_BUILD_DIR/$XCODE_WORKSPACE" \
            --scheme "$XCODE_SCHEME" \
  - name: Create Zip file
    working_directory: build/ios/xcarchive/
    script: |
        find . -type d -name "*.xcarchive" -print | while read -r dir; do
            base_name=$(basename "$dir")
            zip -r "iOSNative.zip" "$base_name"
        done
Next, we will use Emerge Tools REST API to upload the created archive.
The script then executes a two-step process using cURL commands. Initially, it sends a request to Emerge Tools to obtain a URL for uploading the archive. Following this, a second cURL command is executed to upload the zipped file to the provided URL, thereby completing the task.
scripts:
  ...
  - name: Emerge Tools Upload
    working_directory: build/ios/xcarchive/
    script: |
        set -e
        PATH_TO_BUILD_ARTIFACT=/Users/builder/clone/build/ios/xcarchive/iOSNative.zip
        BASE_SHA=$(git rev-parse HEAD~1)
		CURRENT_PR_SHA=$(git rev-parse HEAD)
        json_body=$(jq -n \
        --arg filename "iOSNative.zip" \
        --arg branch "$CM_BRANCH" \
        --arg repoName "$CM_REPO_SLUG" \
        --arg buildType "main" \
        --arg prNumber "$CM_PULL_REQUEST_NUMBER" \
        --arg sha "$CURRENT_PR_SHA" \
        --arg baseSha "$BASE_SHA" \
	    '{
	      filename: $filename,
	      branch: $branch,
	      repoName: $repoName,
	      buildType: $buildType,
	      prNumber: $prNumber,
	      sha: $sha,
	      baseSha: $baseSha
	    }')

        upload_response=$(curl \
        --url "https://api.emergetools.com/upload" \
        --header 'Accept: application/json' \
        --header 'Content-Type: application/json' \
        --header "X-API-Token: $EMERGE_API_KEY" \
        --data "$json_body")
        # Pull the uploadURL field from the response using jq
        upload_url=$(echo "$upload_response" | jq -r .uploadURL)
        curl -v -H 'Content-Type: application/zip' -T "$PATH_TO_BUILD_ARTIFACT" "$upload_url"
This YAML script sets up the basic build process for an iOS app using Emerge Tools with Codemagic CI/CD. You can find the complete codemagic.yaml here for your ready reference.
If you’re using a different CI/CD tool, it’s advisable to refer to its documentation, as the names of the environment variables might differ.
Emerge Tools Insights & Analysis
The Insights dashboard provided by Emerge Tools offers a quick overview of areas within your IPA that can be optimised for better performance and size. This section is dedicated to understanding how this tool can help analyse your app’s size and optimisation, enabling you to make better-informed decisions.
Using Insights dashboard
Emerge Tools has identified several areas to save resources in our sample iOS app. This section is in Size Analysis > Insights in the Emerge Tools dashboard.

The report suggests potential size reductions for our iOS app, with an overall possible decrease of over 42% (these numbers can vary depending on factors like the app’s codebase, graphical assets, use of third-party libraries etc).
Let’s further breakdown each section.
Strip binary symbols (Potential savings: 9.4 MB, 29.58%): You can safely strip these symbols, as they are generally not needed in production builds. In the past, this was handled by bitcode. However, starting from Xcode 14.0, bitcode is disabled by default.
To identify and resolve this, you can manually remove them or use the
stripcommand as shown below:strip -rSTx AppBinary -o AppBinaryStrippedThe
stripcommand is a tool used in Unix-like operating systems, including macOS that removes unnecessary information, such as debugging symbols, from binary files, including executables and libraries. TheTflag tellsstripto remove Swift symbols, the other flags remove debugging and local symbols. The stripped binary will be written to the fileAppBinaryStripped.Remove duplicate files (Potential savings: 3.9 MB, 12.39%): Identical files, possibly resulting from code merges or redundant resources. Removing these duplicates is safe and can help reduce the app’s size.
Optimise images (Potential savings: 76.7 kB, 0.24%): Apps may use high-resolution images that are larger in size than needed for their functionality, leading to unnecessary bloating. Optimising these images through compression or resizing can save space. The main trade-off of this optimisation is a potential slight reduction in image quality, which needs to be carefully considered against the app’s visual requirements and user experience.
Remove binary symbol metadata (Potential savings: 34.2 kB, 0.12%):
This metadata includes identifiers like functions and variables. These elements are included in the metadata of the app’s binary file. However, in many cases, these specific elements are not actually used by other parts of your own app or by other external apps. Since they’re not being utilised, they’re effectively unnecessary within the main file of your app and can be removed to save space.
To remove these unused elements, you can adjust the settings in Xcode:
Open your project in Xcode, go to the build settings, and locate the ‘Other Linker Flags’ section and then add the removal flag
Wl,-exported_symbols_list,/dev/null. This flag tells Xcode’s linker to ignore and remove all exported symbols from the compiled binary, effectively stripping out this unused metadata.It is important to consider whether your app uses symbols dynamically, such as the
dlsym()function, which is often used in tools like Firebase Crashlytics. If your app depends on dynamic symbol usage, you should carefully choose which symbols to remove as it can affect your app functionality.
Additionally there are two types of code elements that can be optimised.
First, there are 9 Swift protocols, which are like definitions that are declared but not implemented by any classes, structs, or enums. Since they’re not actively contributing to the app’s functionality, removing them can streamline your code. The reason for encountering this scenario maybe due to evolving codebases where certain features are planned and protocols are defined, but later on, the actual implementation changes or the feature itself is no longer needed.
Removing these unused protocols is generally safe. The main consideration before removal is ensuring that these protocols are not used anywhere in the app.
You can find these unused protocols by thoroughly reviewing their code or using code analysis tools like Periphery (available on GitHub). Periphery is designed to scan your Swift project to detect code that is no longer in use, including unused protocols.
Second, there are 15 static initializers, which are responsible for setting up certain parts of the app during launch. Too many of these can slow down the app’s start time. The typical reason for an excessive number of static initializers often comes from an app’s evolution, where new features and functionalities are added without fully considering their impact on the app’s launch performance.
The removal or modification of static initializers should be done with a thorough understanding of what each initializer does and ensuring that its functionality is either no longer needed or can be implemented more efficiently.
Tools like Xcode’s Instruments provide a way to analyse an app’s startup time, particularly focusing on the launch sequence profile, and identify which initializers are taking the most time. By evaluating and reducing these, you can enhance the app’s startup speed.
You can read more about Xcode instruments here.
Further reviewing above optimisations, we were able to reduce the app size by approximately 38% for our sample iOS App. More information can be found below.
Using Visual Treemap
The Emerge Tools Treemap is powerful tool that simplifies complex data into easy-to-understand insights. It provides valuable information regarding which parts of your application are occupying the most space, allowing you to identify areas where targeted changes can be made to reduce the overall size of the app.
The treemap offers a comprehensive overview of the app’s composition by categorising app elements based on size and importance. It organises and displays the files and folders contributing to the app’s size, offering critical size statistics.
You can navigate the TreeMap by scrolling or clicking to zoom into specific areas, with smaller regions expanding as you zoom in. The feature also allows for searching particular files or modules and colour-coding different file types, such as binaries, localisations, and assets, for easy identification.
Emerge Tools breaks down compiled files to display the size contribution of each resource and source code, helping you understand and manage your app’s size efficiently.
Watch the video below demonstrating the Treemap View within your Emerge Tools dashboard.
Conclusion: Streamlining App Size with Emerge Tools in CI/CD.
Incorporating Emerge Tools into the CI/CD pipelines can significantly enhance the app development process when it comes to managing the size of the app. By integrating with pull requests, Emerge Tools provides developers with immediate feedback on the impact of changes without requiring manual intervention, enabling them to make informed decisions about their apps. By constantly tracking the size of their apps and evaluating how adding new functionalities or updates affects them, developers can focus on performance of their apps and make necessary optimisations.


